



Excel or Power BI: Which Tool Should You Choose to Analyze Your Data?

Excel and Power BI are two widely used Microsoft tools for organizing, analyzing, and presenting data. Both allow users to import information, perform calculations, and create visual representations that support decision-making.
However, they are not used in exactly the same way.
Excel remains particularly effective for performing calculations, quickly exploring a dataset, and producing one-time analyses. Power BI is designed to connect multiple sources, model data, and create interactive dashboards that can be refreshed and shared.
The decision is therefore not necessarily about determining which software is better. Instead, it is about identifying which one best suits the volume of data, type of analysis, intended audience, and frequency of report production.
Excel and Power BI: Two Complementary Tools
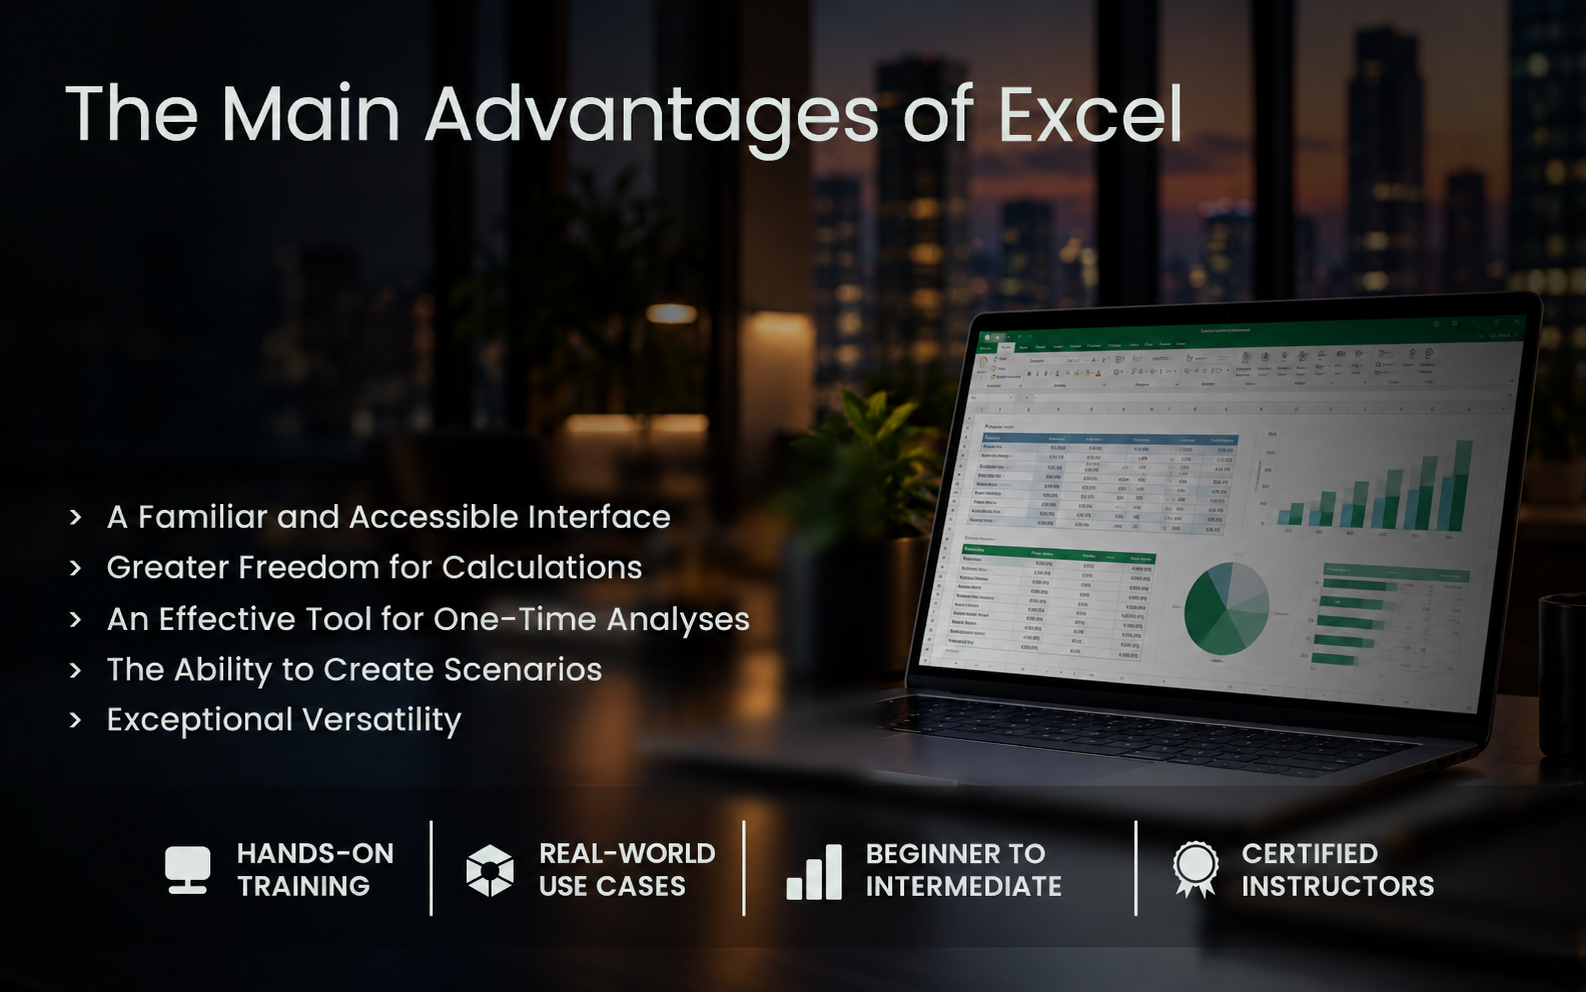
Excel is a versatile spreadsheet application. It allows users to enter data directly, create formulas, run simulations, build PivotTables, and present results using charts.
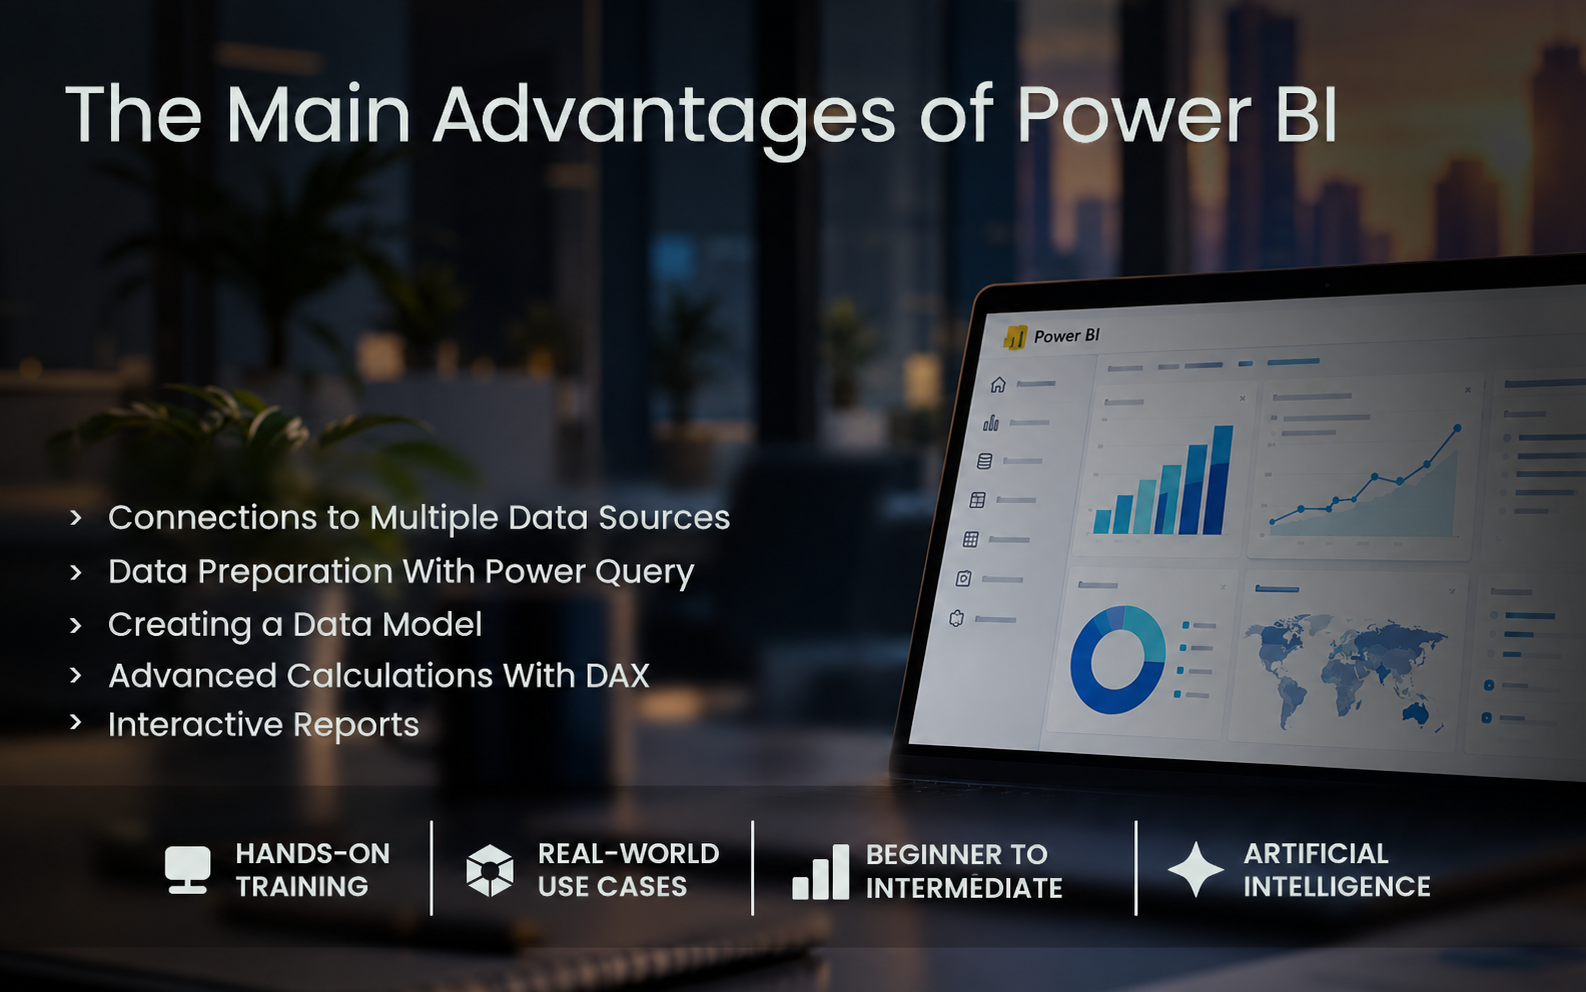
Power BI is a business intelligence platform. It can connect different data sources, transform information, create relationships between tables, and produce interactive reports.
Both solutions can be used at different stages of the same project.
For example, Excel can be used to prepare a budget file or conduct an exploratory analysis. The data can then be integrated into Power BI to produce a dashboard for managers.
It is therefore not always necessary to choose one over the other. In many organizations, Excel and Power BI work together.
When Should You Choose Excel?
Excel is often the most effective choice when users need to work directly with data and obtain results quickly.
Excel is particularly well suited to the following tasks:
- performing one-time calculations;
- creating a budget or forecast;
- producing a list or register;
- comparing several scenarios;
- applying customized formulas;
- building a PivotTable;
- creating a simple chart;
- analyzing a reasonable volume of data;
- manually modifying specific values;
- sharing a working file with a small number of people.
Its cell-based structure provides considerable freedom. Users can enter a value, add a formula, modify an assumption, and immediately observe the result.
This flexibility explains why Excel remains a central tool across many departments, including finance, administration, human resources, sales, marketing, project management, and operations.
What Are the Limitations of Excel?
Excel’s flexibility can also become a weakness as files grow larger and more complex.
A workbook containing several worksheets, thousands of formulas, and numerous versions can become difficult to maintain. A cell modified by mistake, an overwritten formula, or an outdated source can compromise the accuracy of the analysis.
Difficulties often arise when:
- data volumes increase;
- several files must be combined;
- the same operations are repeated every week or month;
- several people use different versions of the document;
- reports must be refreshed frequently;
- data comes from multiple systems;
- the organization wants to distribute an interactive dashboard;
- security and access permissions become important.
In these situations, Power BI may provide a more suitable structure.
When Should You Choose Power BI?
Power BI is well suited to projects requiring recurring analysis, multiple data sources, and an interactive presentation of results.
Power BI is particularly useful for:
- connecting Excel files, databases, and online services;
- cleaning and transforming data;
- establishing relationships between multiple tables;
- creating performance indicators;
- automating report refreshes;
- building interactive visualizations;
- filtering results according to different criteria;
- analyzing a period, region, product, or service;
- sharing dashboards with a team;
- centralizing the presentation of information.
Instead of manually producing a new report for every reporting period, users build a model that can be supplied with updated data.
This approach reduces repetitive operations and allows more time to be devoted to interpreting the results.
What Are the Limitations of Power BI?
Power BI requires a more structured approach than Excel.
Before creating charts, users generally need to prepare the data, understand the relationships between tables, and define the indicators they want to measure.
A visually attractive dashboard does not guarantee reliable analysis. If the model contains incorrect relationships or a DAX measure is inaccurate, the report may present misleading results.
Power BI can also be less practical when users need to enter or frequently modify individual values. It is primarily designed to analyze and present data from other sources, not to replace every function of a spreadsheet.
Excel or Power BI: A Quick Comparison
| Requirement | Excel | Power BI |
|---|---|---|
| Enter and modify data directly | Excellent | Limited |
| Perform one-time calculations | Excellent | Possible, but more structured |
| Create budgets and simulations | Excellent | Less suitable |
| Work with cell-by-cell formulas | Excellent | No |
| Build PivotTables | Yes | Uses visuals and a data model instead |
| Connect multiple data sources | Possible | Excellent |
| Clean recurring data | Power Query available | Power Query integrated into the process |
| Model multiple tables | Possible with the Data Model | A core function |
| Create interactive dashboards | Limited | Excellent |
| Refresh reports regularly | Possible | Designed for this purpose |
| Share a static analysis | Simple | Possible |
| Distribute interactive reports | Limited | Excellent |
| Manage large-scale analyses | Can become complex | Better suited |
| Initial learning curve | Generally more accessible | Steeper |
Which Tool Should You Choose for Your Situation?
Choose Excel if you need to:
- perform an analysis quickly;
- enter or correct values manually;
- work with customized calculations;
- build a budget;
- test several scenarios;
- produce a table for one-time use;
- work with a relatively self-contained file.
Choose Power BI if you need to:
- combine multiple data sources;
- produce the same reports regularly;
- automate data preparation;
- monitor performance indicators;
- build an interactive dashboard;
- allow managers to explore the results;
- share a centralized version of the information;
- analyze larger or more complex datasets.
Use both if you need to:
- prepare certain data in Excel;
- combine that data with other sources;
- perform exploratory calculations before modelling;
- publish the results in a Power BI dashboard;
- provide users with both an interactive overview and a detailed file.
This combined approach is common because it takes advantage of the strengths of both tools.
Why Take an Excel or Power BI Course?
Both applications can be explored independently, but structured training helps users avoid habits that make files and reports difficult to maintain.
Excel training can help you:
- use formulas and functions effectively;
- organize data consistently;
- create tables and charts;
- build PivotTables;
- automate certain tasks;
- reduce errors and repetitive operations.
Power BI training can help you:
- connect different data sources;
- transform data with Power Query;
- build a data model;
- create measures with DAX;
- design relevant visualizations;
- produce interactive dashboards;
- publish and share reports.
The right training therefore depends on the type of work you want to accomplish.
Choose the Training That Matches Your Objectives
Would you like to organize your data more effectively, perform calculations, automate certain tasks, or produce analyses in a familiar environment?
Discover the Complete Excel Training Course
Do you need to connect multiple sources, create performance indicators, and produce interactive dashboards?
Discover the Complete Power BI Training Course
Doussou Formation’s courses are available through live virtual classrooms or in person in Montreal and Quebec City. They emphasize a practical approach that allows participants to apply what they learn quickly in a professional context.